One-time projects
Project-based science assets.
A specific science communication project, from scientific illustration to a finished, presentation-ready asset. Fixed scope, fixed price, agreed timeline.
Trusted by 30+ agriculture and biological brands
01 Scientific Illustration
Invisible science, visible.
Scientific illustration is useful when your audience needs to understand a process they cannot observe directly: root-microbe interactions, soil carbon flow, nutrient movement, pH chemistry, biological activity, or product mode of action. Created from product notes, research papers, trial context, or expert interviews, and scientifically reviewed before delivery.
Best used for
- Technical mechanisms, product education, and sales explanations that need a visual to make the science land.
- Website visuals and presentations
- Mode of action explainers and sales education
- Plant-Microbe Mechanisms of Nitrogen CyclingHow plant-microbe interactions drive nitrogen cycling in the root zone.
- The Backbone of Modern BiologicalsThe core biological players behind modern biological products.
- Biological Pathways and Soil Water-Holding CapacityHow root-driven biological pathways shape soil’s ability to hold water.
- Bacterial Movement in the HyphosphereHow bacteria travel along fungal networks in the root zone.
- Where Does Fertilizer Phosphorus Go?Tracing the fate of applied phosphorus through the soil system.
- When Soil Biology Becomes ActiveA clear visual of biological activity waking up in the root zone.
02 Explainer Animation
Show the process in motion.
Some science is easier to understand when people can follow the steps. Explainer animations help show what happens over time: water correction, microbial activation, nutrient movement, product delivery, carbon cycling, or biological response.
Typical build
- Script and storyboard — clarify the mechanism and message, then break it into scenes.
- Illustration and motion — build the scientific visuals, then animate the flow.
03 Infographics
One idea. One clear graphic.
Infographics are for one focused teaching goal: a mechanism, a comparison, a trial result, a product claim, or a field problem. Polished infographic assets, not LinkedIn visual posts.
Best used for
- Explaining how a product works and why the science matters, with mode-of-action and before/after visuals.
- Translating trial results and research findings into a clear visual story.
- Problem-solution diagrams and field problem education.
- CoolGrowth Product ScienceA product mechanism explained as a clear customer-facing visual.
- CoolEmerge Product ScienceA field problem translated into a clear, focused infographic.
- Silicon: The Underrated AllyA nutrient and plant-health story shaped into a polished infographic.
- K9 Correcter Product ScienceHow the product corrects lawn damage, shown as a clear mechanism graphic.
- Lawnies: Soil Life in the LawnMaking the biology under a lawn visible and easy to understand.
- The Power of EC and CECA core soil chemistry concept explained in one focused visual.
Client case study
Educational infographics for a global platform.
Infographics developed for the Sustainable Fertilizer Academy (IFA & SPRPN) microlearning platform, translating plant nutrition and fertilizer science into clear visual learning resources for agronomists, crop advisors, and agriculture professionals worldwide.
- Created systematic visual infographics breaking down complex fertilizer and plant nutrition science into learnable sequences professionals can act on.
- Built for global professional development, used by agronomists, crop advisors, and agriculture students through one of the fertilizer industry’s largest education platforms.
- Science communication that bridges technical research and practical field understanding, reaching professionals across multiple countries and crop systems.
-
Client
IFA & SPRPN
Global fertilizer industry education initiative.
-
Format
Educational Infographics
Visual learning resources for the SFA microlearning platform.
-
Reach
Worldwide
Agronomists, crop advisors, and agriculture professionals across multiple countries.
04 Brochures
Brochures that teach first.
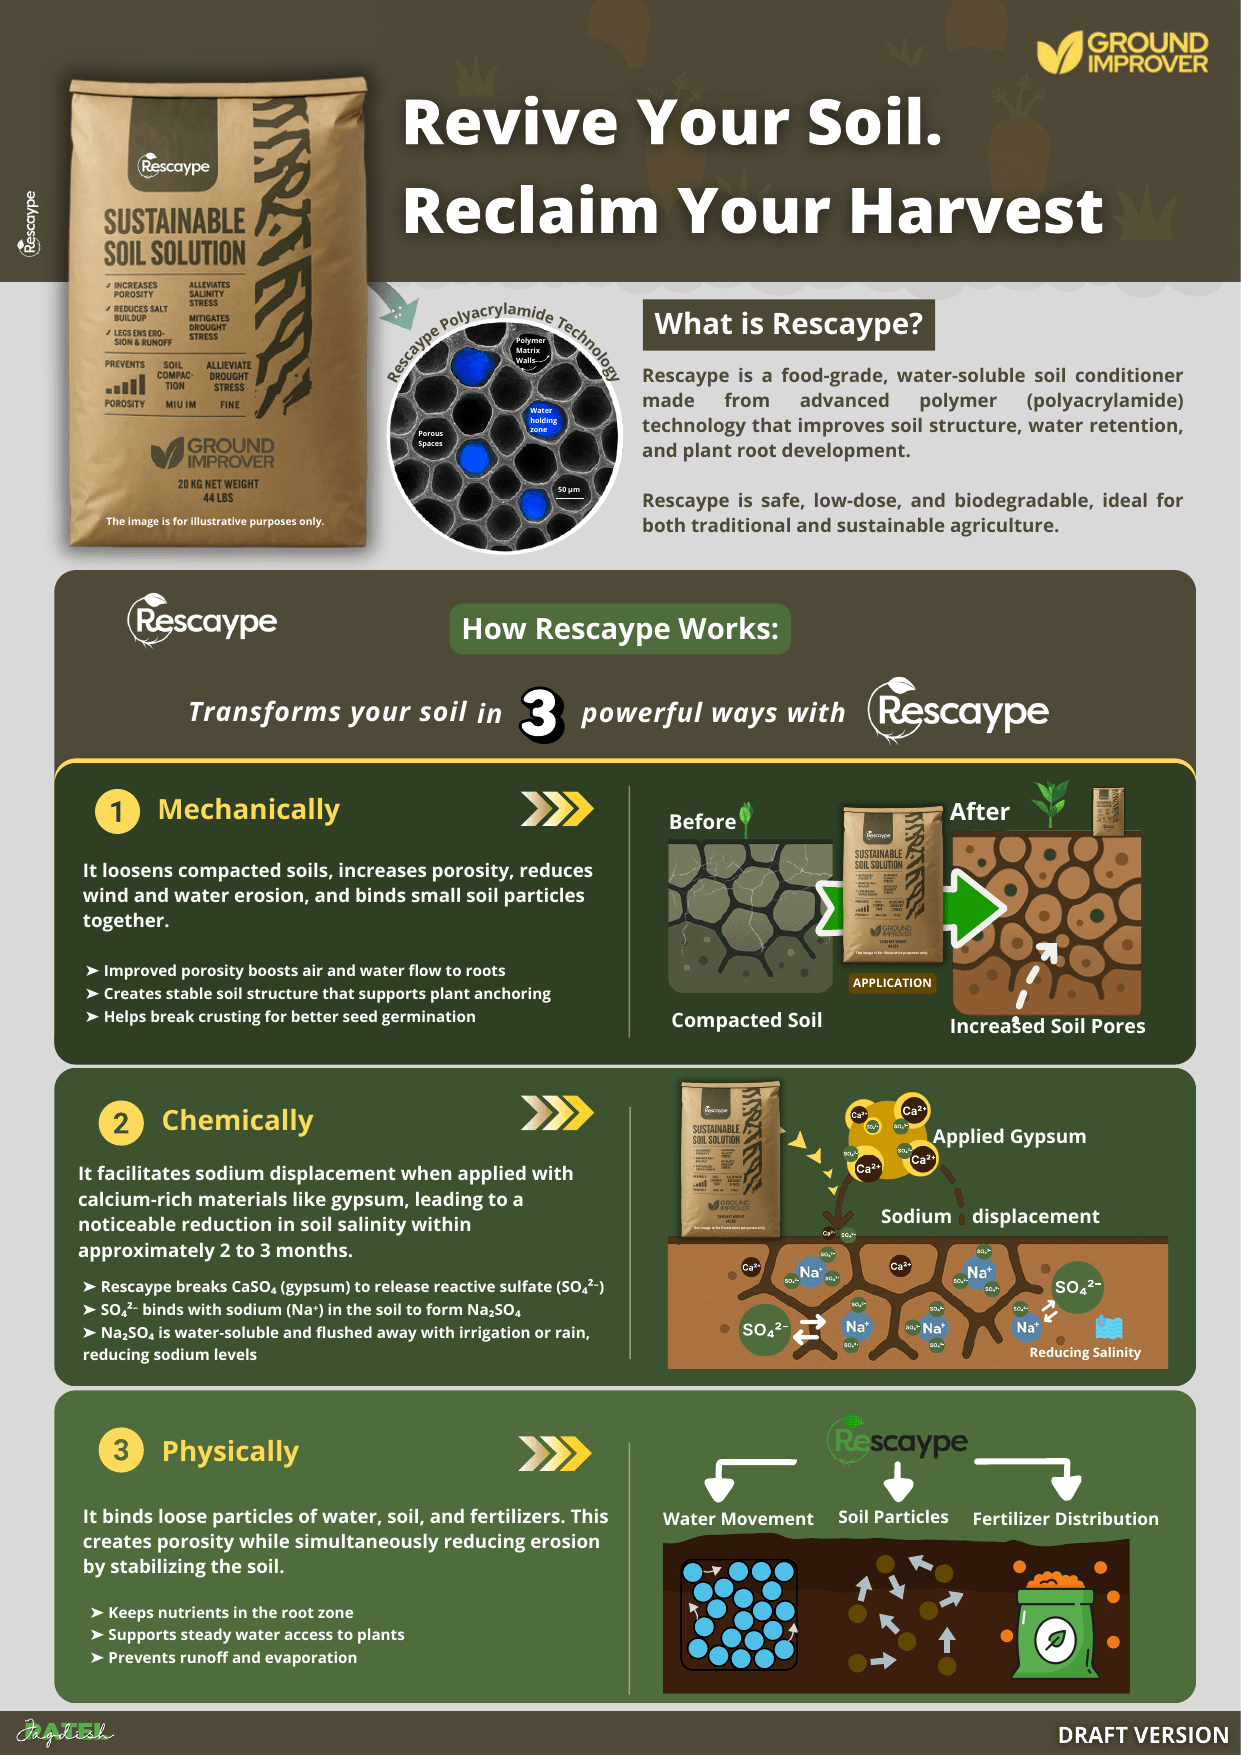
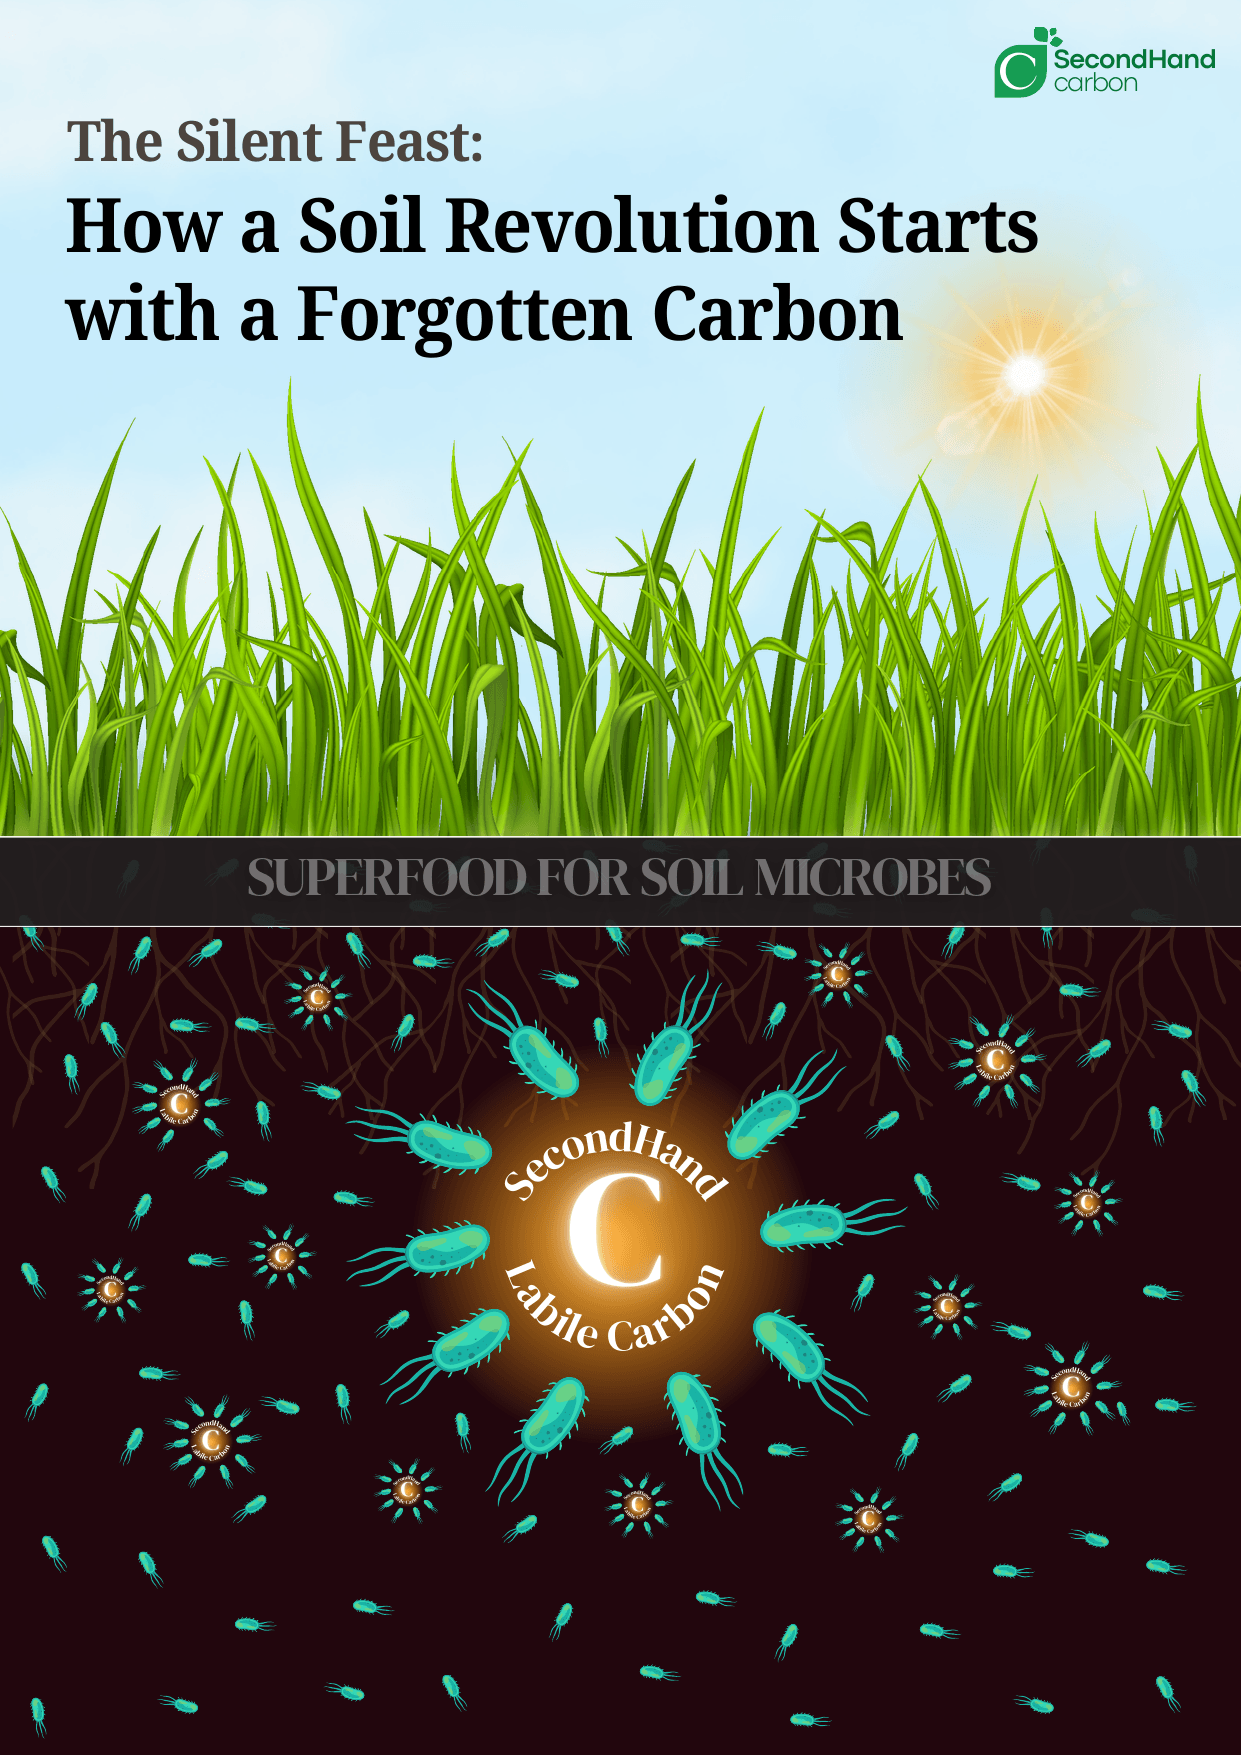
A brochure is strongest when it explains the product mechanism, the field problem, the evidence, and the reason the solution matters. Not just a pretty PDF; a useful science-based sales asset.
Best used for
- Product launches, distributor education, sales conversations, and trade show support (4 to 8 page visual brochures).
- Campaigns or product families that need a connected set of assets: brochure, slide visuals, and customer handouts.

05 Science Articles
Articles that explain science.
Articles are useful when a topic needs more explanation than a visual can carry. I turn research papers, technical notes, founder knowledge, or internal expertise into readable science education, written with enough accuracy for experts and enough clarity for the market.
Best used for
- Educational articles, founder thought-leadership pieces, and website science explainers.
- Soil health, biologicals, carbon, water treatment, and plant nutrition.
- A single article can become a source asset for other communication material later.
06 Website & Presentation Science
Science for websites and decks.
Many agriculture websites explain features and benefits but skip the science that builds trust. I create science sections, diagrams, homepage explanations, product page visuals, and presentation slides that make the technical story easier to follow.
Best used for
- Website science communication for product pages, technology pages, and technical explainers.
- Presentation visuals for sales teams, webinars, investors, distributors, and customer education.
- Reusable diagrams and explanation blocks that can support future content.
-
Website
Your page has claims but not enough explanation.
Add visual science sections that help people understand the mechanism.
-
Presentation
Your sales deck needs stronger technical clarity.
Turn complex slides into visuals that are easier to present and remember.
-
Education
Your team repeats the same explanation often.
Create reusable visual material for customers, distributors, and internal teams.
How to start
From first call to final delivery.
Every project starts by understanding the science, the communication goal, the scope, and the deliverable you need, before any work begins.
Book a call
Tell me about your project, science, audience, and what you need to communicate.
NDA, if required
If the project involves confidential research, product information, or unpublished data, an NDA can be signed before technical material is shared.
Scope & discussion
We define the deliverable, scientific requirements, timeline, and project scope before work begins.
Payment & start
Once the scope is approved and payment is arranged, the project moves into development.
First delivery
I research, interpret, and create the agreed scientific communication asset for your review.
Review & final files
Two rounds of revisions are included, followed by delivery of the approved final files.
Have a project in mind?
Tell me what you need to explain.
Send me your product, research, technical material, or initial idea. I’ll help define the right format, scope, and deliverable for the project.
Rate card
Receive the rate card
Full pricing for content partnerships and project-based work, sent straight to your inbox.
Book a free discovery call
30 min · Jagdish Patel, Soil Stories